Agent Dependency Graph
A structural "what is this agent made of" view, complementary to the
workflow visualization (which shows how the workflow flows). Find it
under the Dependencies tab on any
/agents/{name} detail page.
What it shows
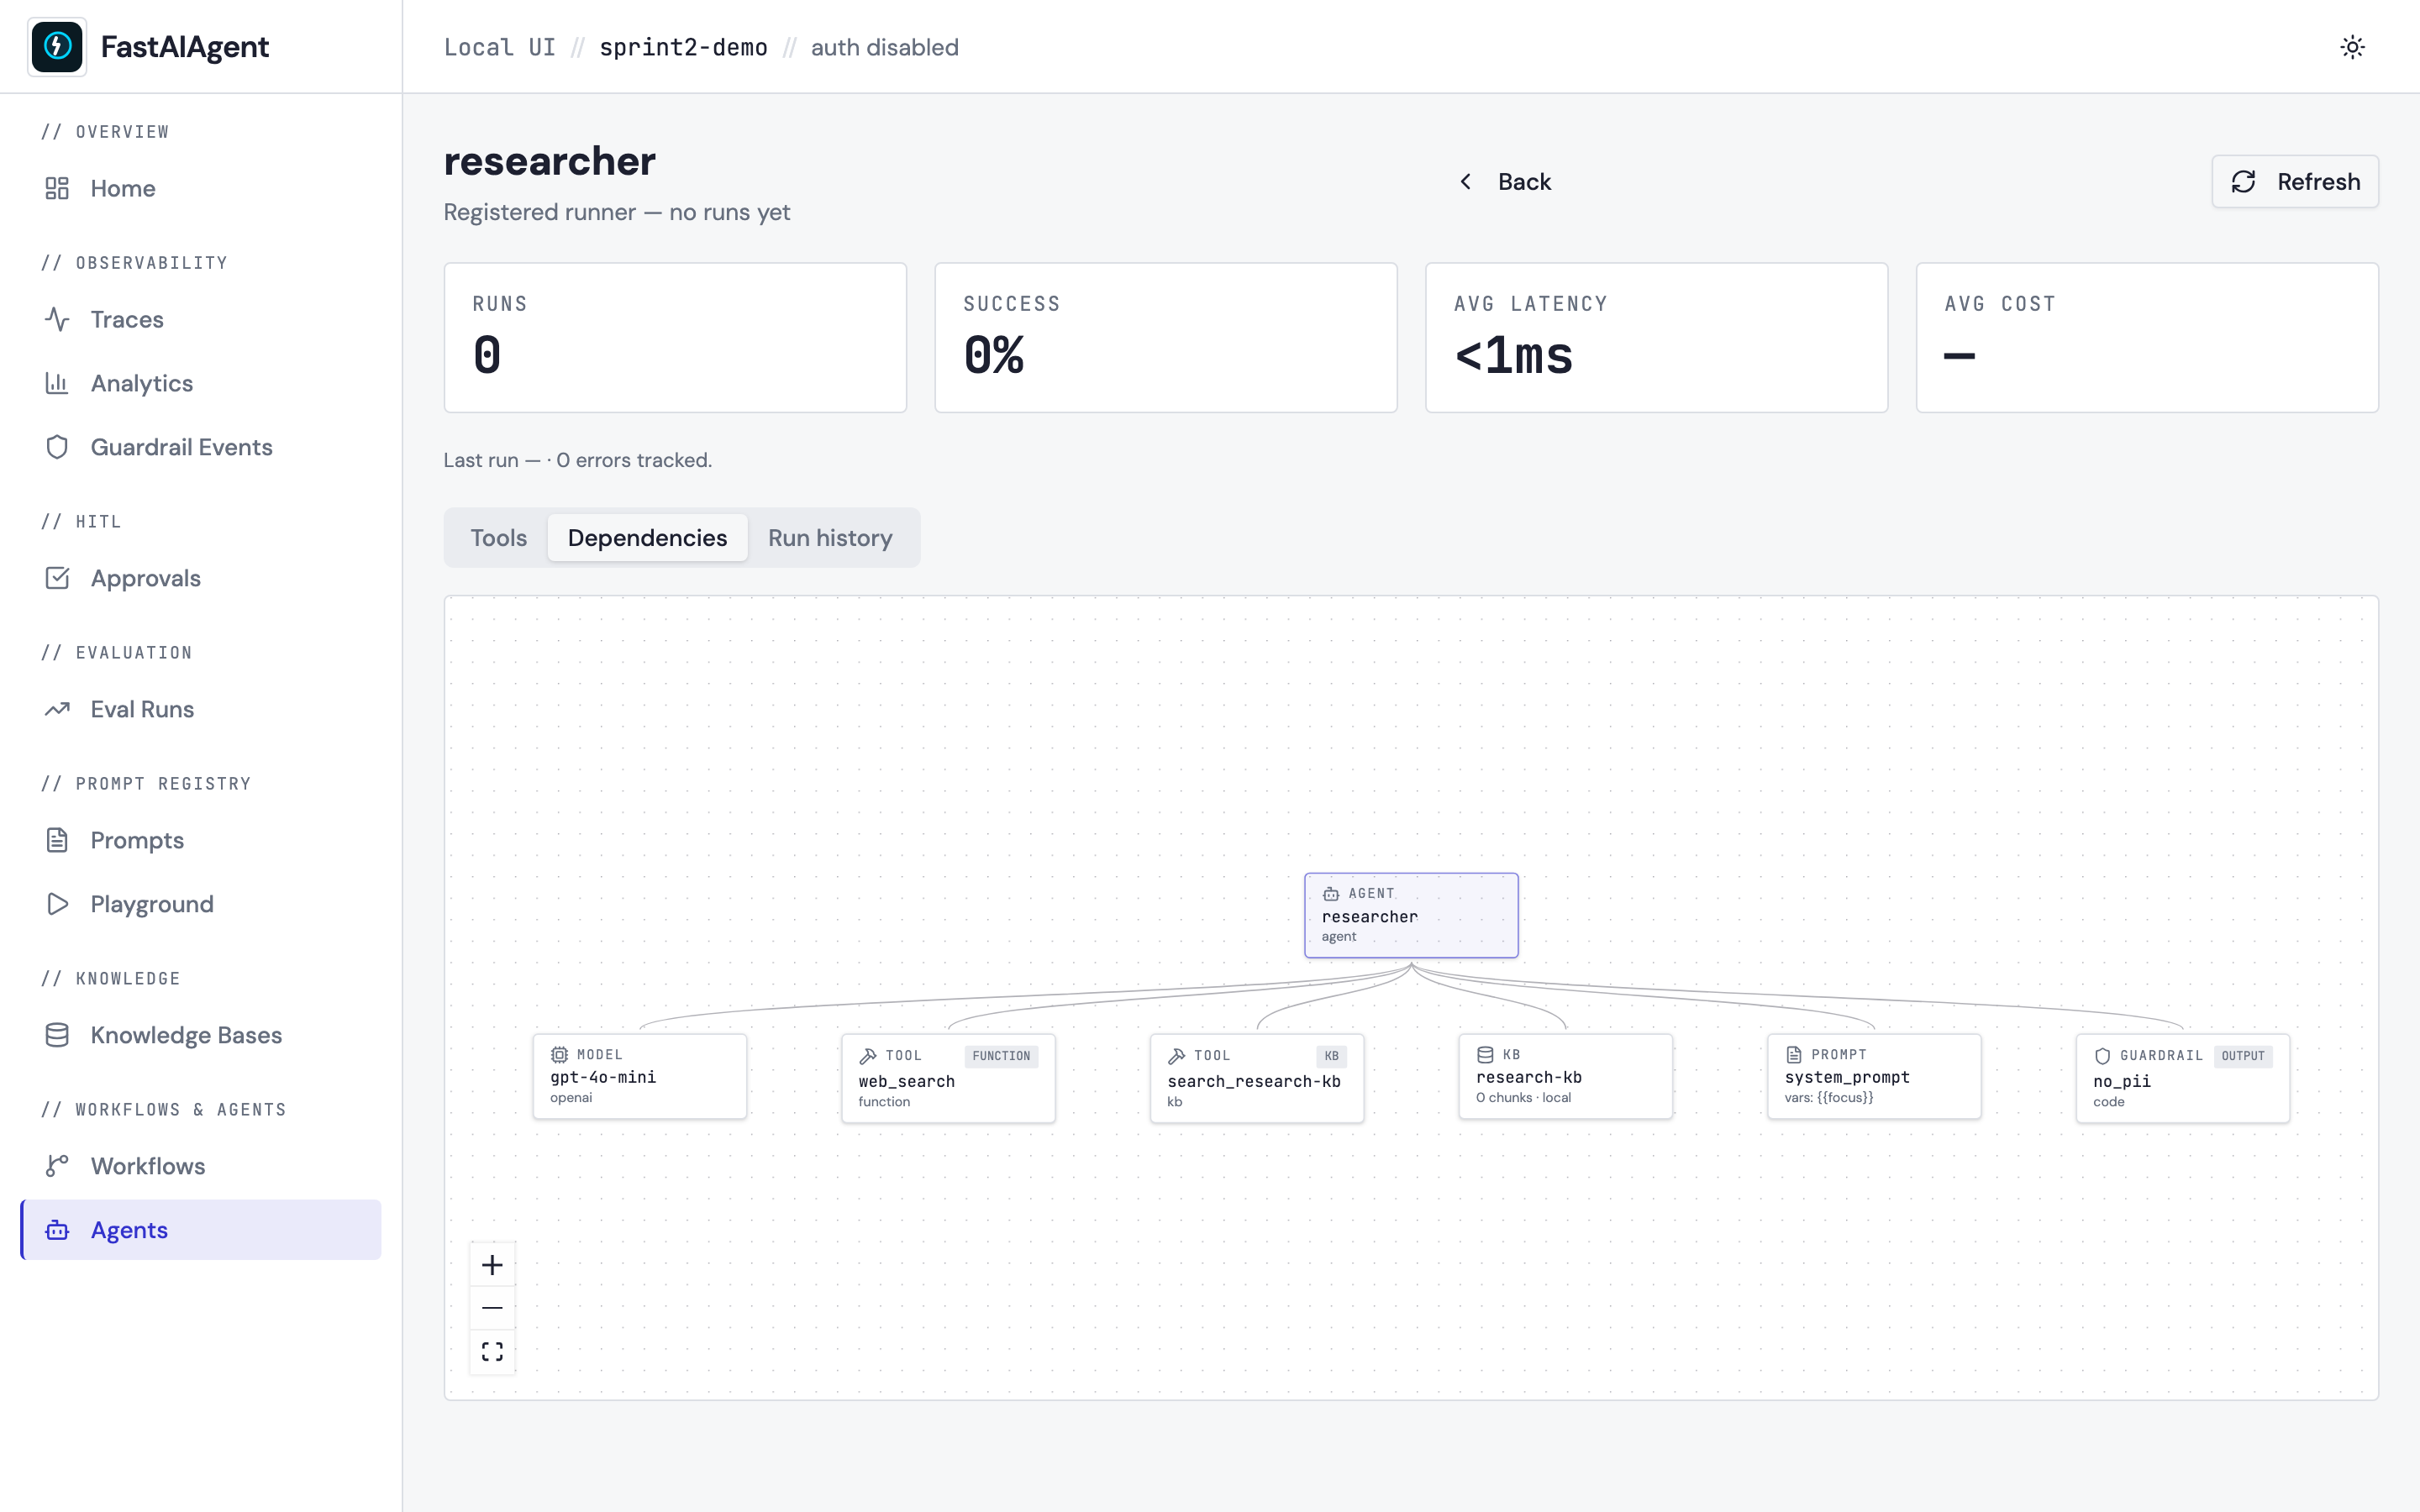
For a single Agent:
- The agent itself at the centre.
- Its model (provider + model name) as a directly connected node.
- Every tool the agent was constructed with — green when registered,
amber when the LLM has called a name that wasn't in
tools=[…](likely hallucination). - Every knowledge base referenced via
LocalKB.as_tool()— name, backend (FAISS / Qdrant / Chroma), chunk count. - Every guardrail with its type (
code/regex/llm_judge/ …) and position (input/output/tool_call/tool_result). - The system prompt as a single node, with
{{variables}}extracted off the template so you can see at a glance what the prompt expects to be filled with.
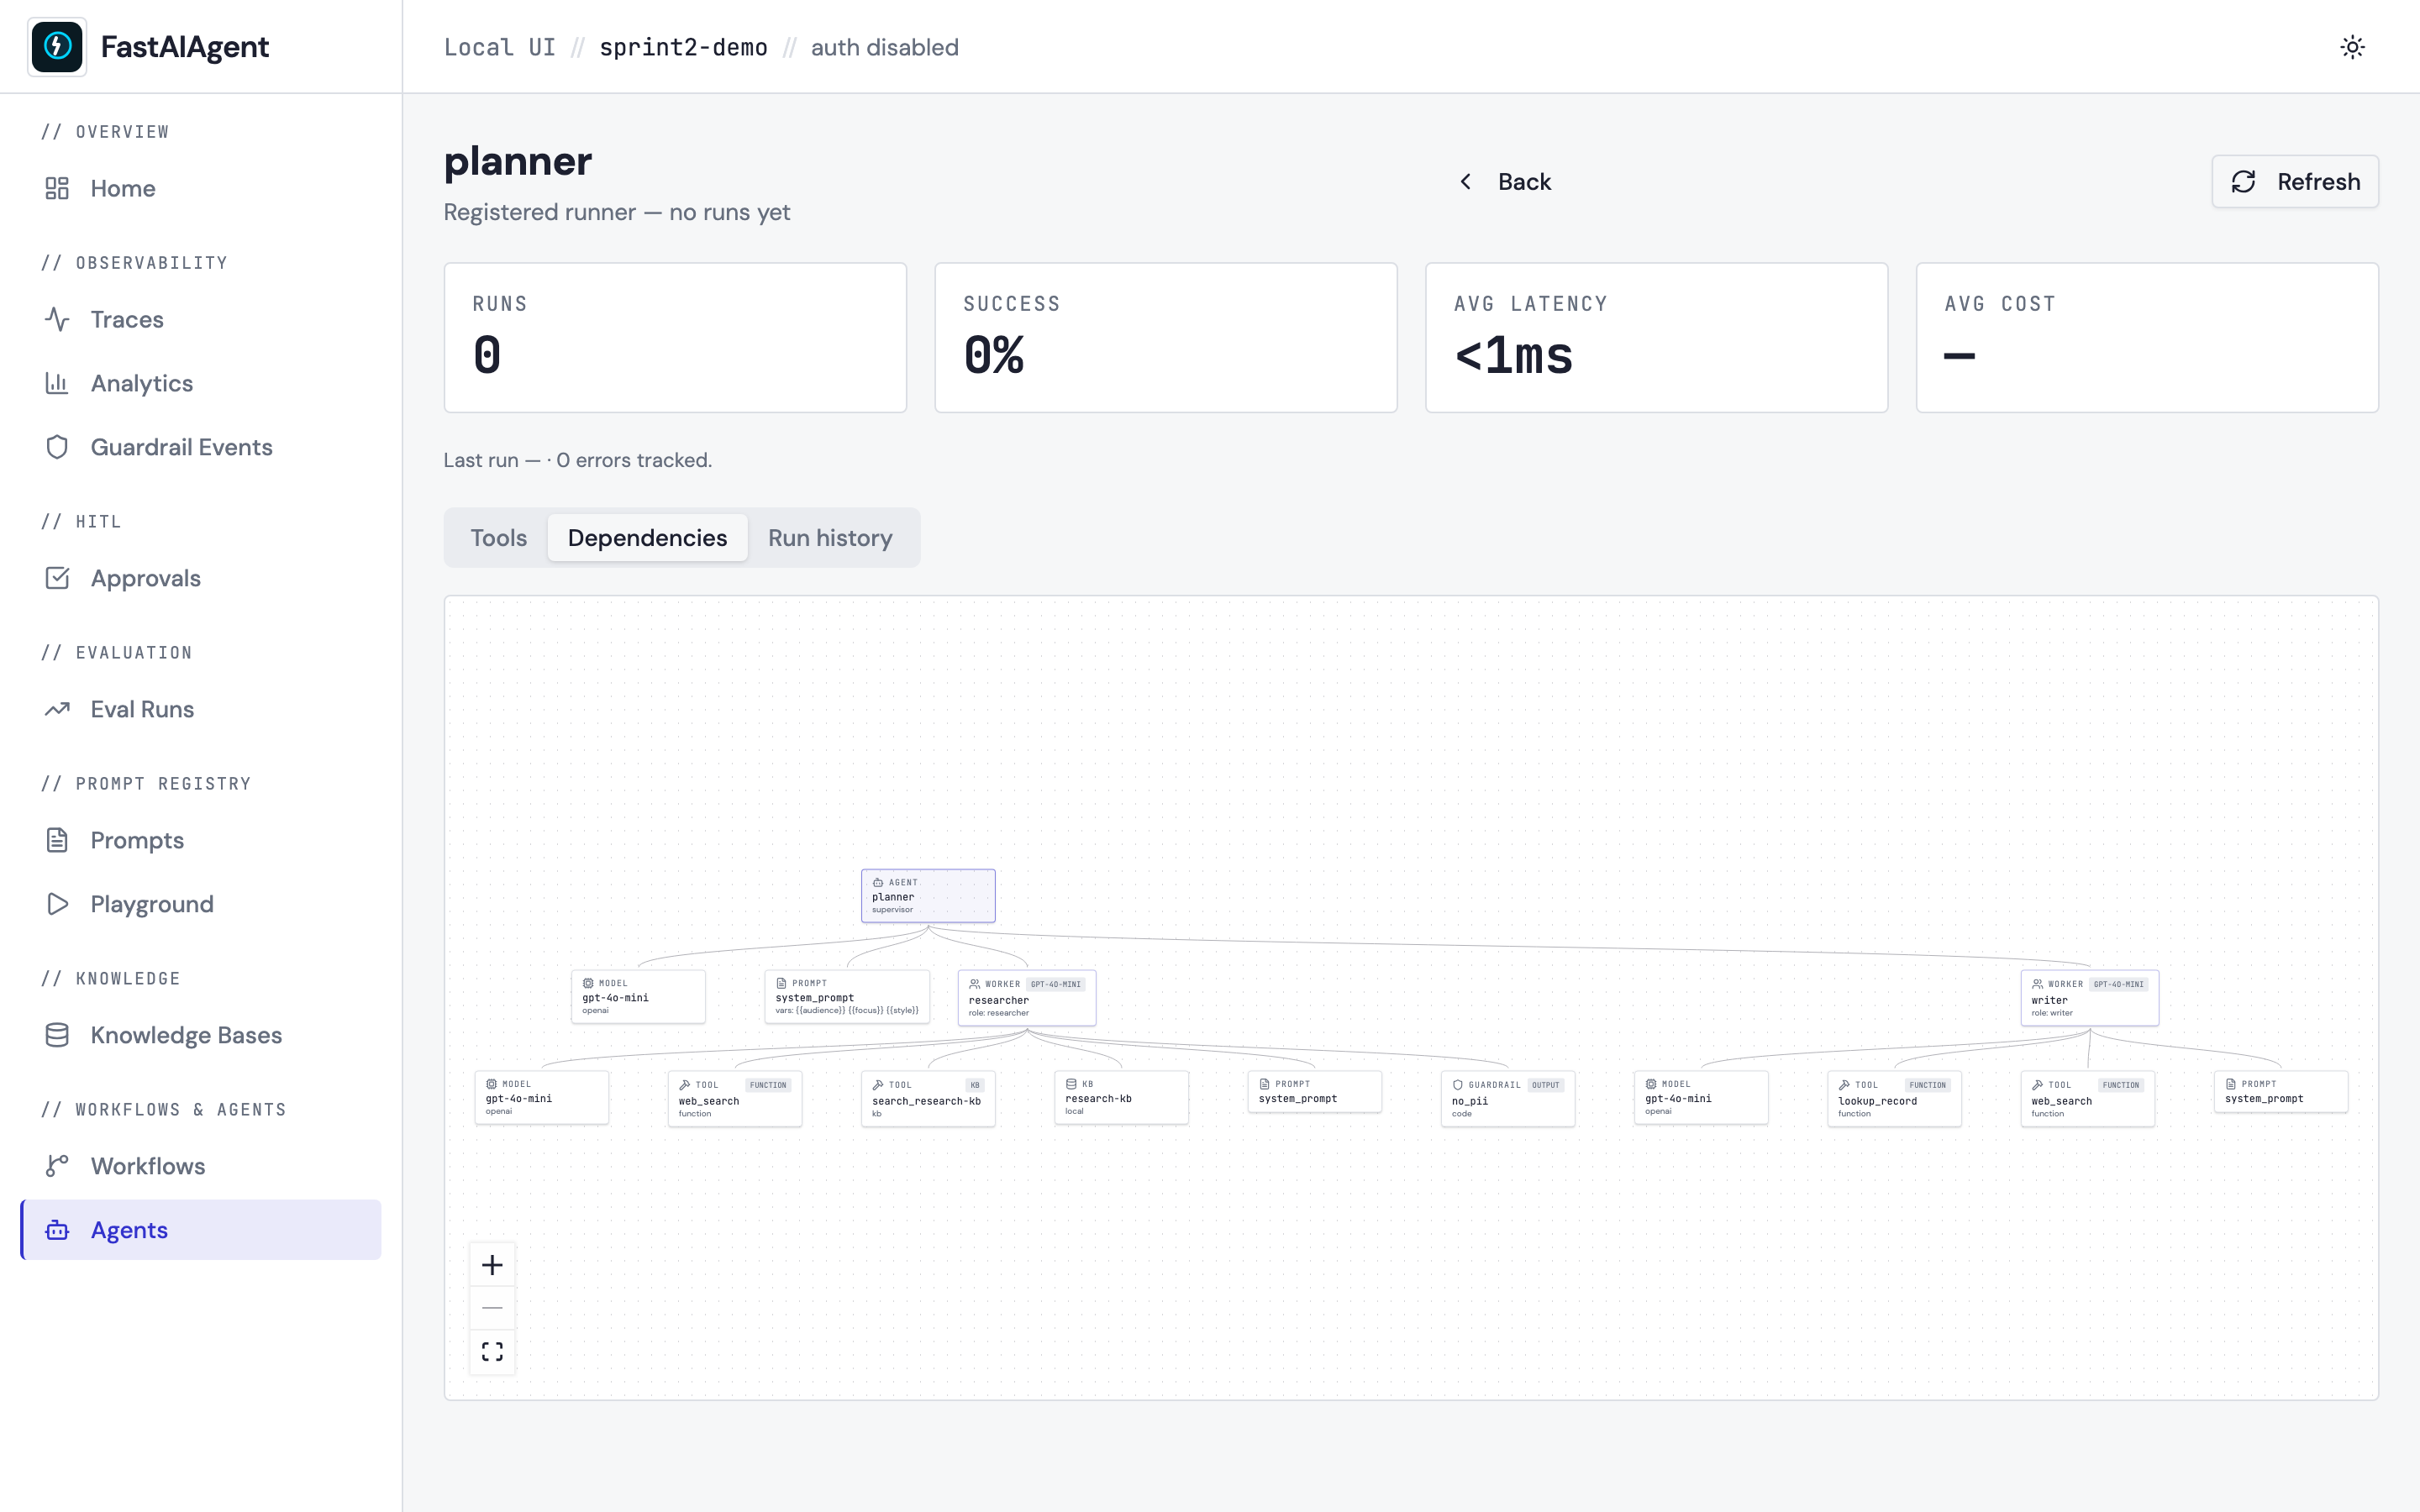
For a Supervisor, each Worker appears as a sub-agent under the supervisor centre node, with its own tool / KB / prompt subtree:
[Supervisor: planner]
   ├── [Worker: researcher]
   │     ├── [Tool: web_search]
   │     ├── [KB: research-kb]
   │     └── [Model: gpt-4o-mini]
   └── [Worker: writer]
         ├── [Tool: lookup_record]
         └── [Model: gpt-4o-mini]
For a Swarm, peer agents appear as siblings of the centre node with handoff edges drawn between them:
Click any node to open a side panel with details (call count, success rate, avg latency for tools; chunk count + backend for KBs; variables + preview for prompts) plus an Open button that navigates to the dependency's own page.
Endpoint
Response shape (single agent):
{
  "agent": {
    "name": "support-bot",
    "type": "agent",
    "provider": "openai",
    "model": "gpt-4o-mini"
  },
  "model": {"provider": "openai", "model": "gpt-4o-mini"},
  "tools": [
    {
      "name": "lookup_record",
      "origin": "function",
      "registered": true,
      "calls": 28,
      "success_rate": 1.0,
      "avg_latency_ms": 42.0
    },
    {
      "name": "ghost_tool",
      "origin": "unknown",
      "registered": false,
      "calls": 3,
      "success_rate": 0.66,
      "avg_latency_ms": 0
    }
  ],
  "knowledge_bases": [
    {"name": "support-kb", "backend": "faiss", "chunks": 128}
  ],
  "prompts": [
    {
      "name": "system_prompt",
      "version": null,
      "variables": ["customer_name", "topic"],
      "preview": "You are a friendly support agent…"
    }
  ],
  "guardrails": [
    {"name": "no_pii", "guardrail_type": "regex", "position": "output"}
  ],
  "sub_agents": []
}
For Supervisors, sub_agents[] carries one fully populated payload per
worker (with an extra role field). For Swarms, peers[] lists the
other agents and handoffs[] lists the allowed source/target pairs.
Data sources
The endpoint walks the runtime registry (ctx.runners) populated by
build_app(runners=[…]). To get the rich graph, register your top-level
runner there:
Or from the CLI, which populates the same registry:
When no runner is registered, the endpoint reconstructs a degraded view
from agent.tools / agent.guardrails / agent.llm.* span attributes
on the most-recent root agent span — the same data the existing
Tools tab uses. The response carries unresolved: true and the UI
shows a "register your runner for the full view" callout.
Tool call counts, success rate, and average latency come from the
tool.* spans under each agent.* span — same aggregation the existing
Tools tab does, kept consistent on purpose.
Difference vs. Workflow Topology
| Question | Use |
|---|---|
| What's my agent made of? (tools / KBs / model) | Dependency graph |
| How does my chain/swarm/supervisor flow at runtime? | Workflow visualization |
| Which tool was actually called and how often? | Agent → Tools tab |
The three views share the same React Flow canvas and visual language.
Example
examples/50_agent_dependencies.py builds a Supervisor with two Workers (each with a different toolset and KB), registers them, and prints the URL where the Dependencies tab will render the graph.