Cost tracking dashboard
The Analytics page now ships a // COST BREAKDOWN section below the
existing latency / cost / error / volume charts. Three tabs slice the
spans table three ways: by LLM model, by agent, and by chain node.
Numbers come from the same compute_cost_usd() table that powers the
existing per-trace cost column — no double bookkeeping.
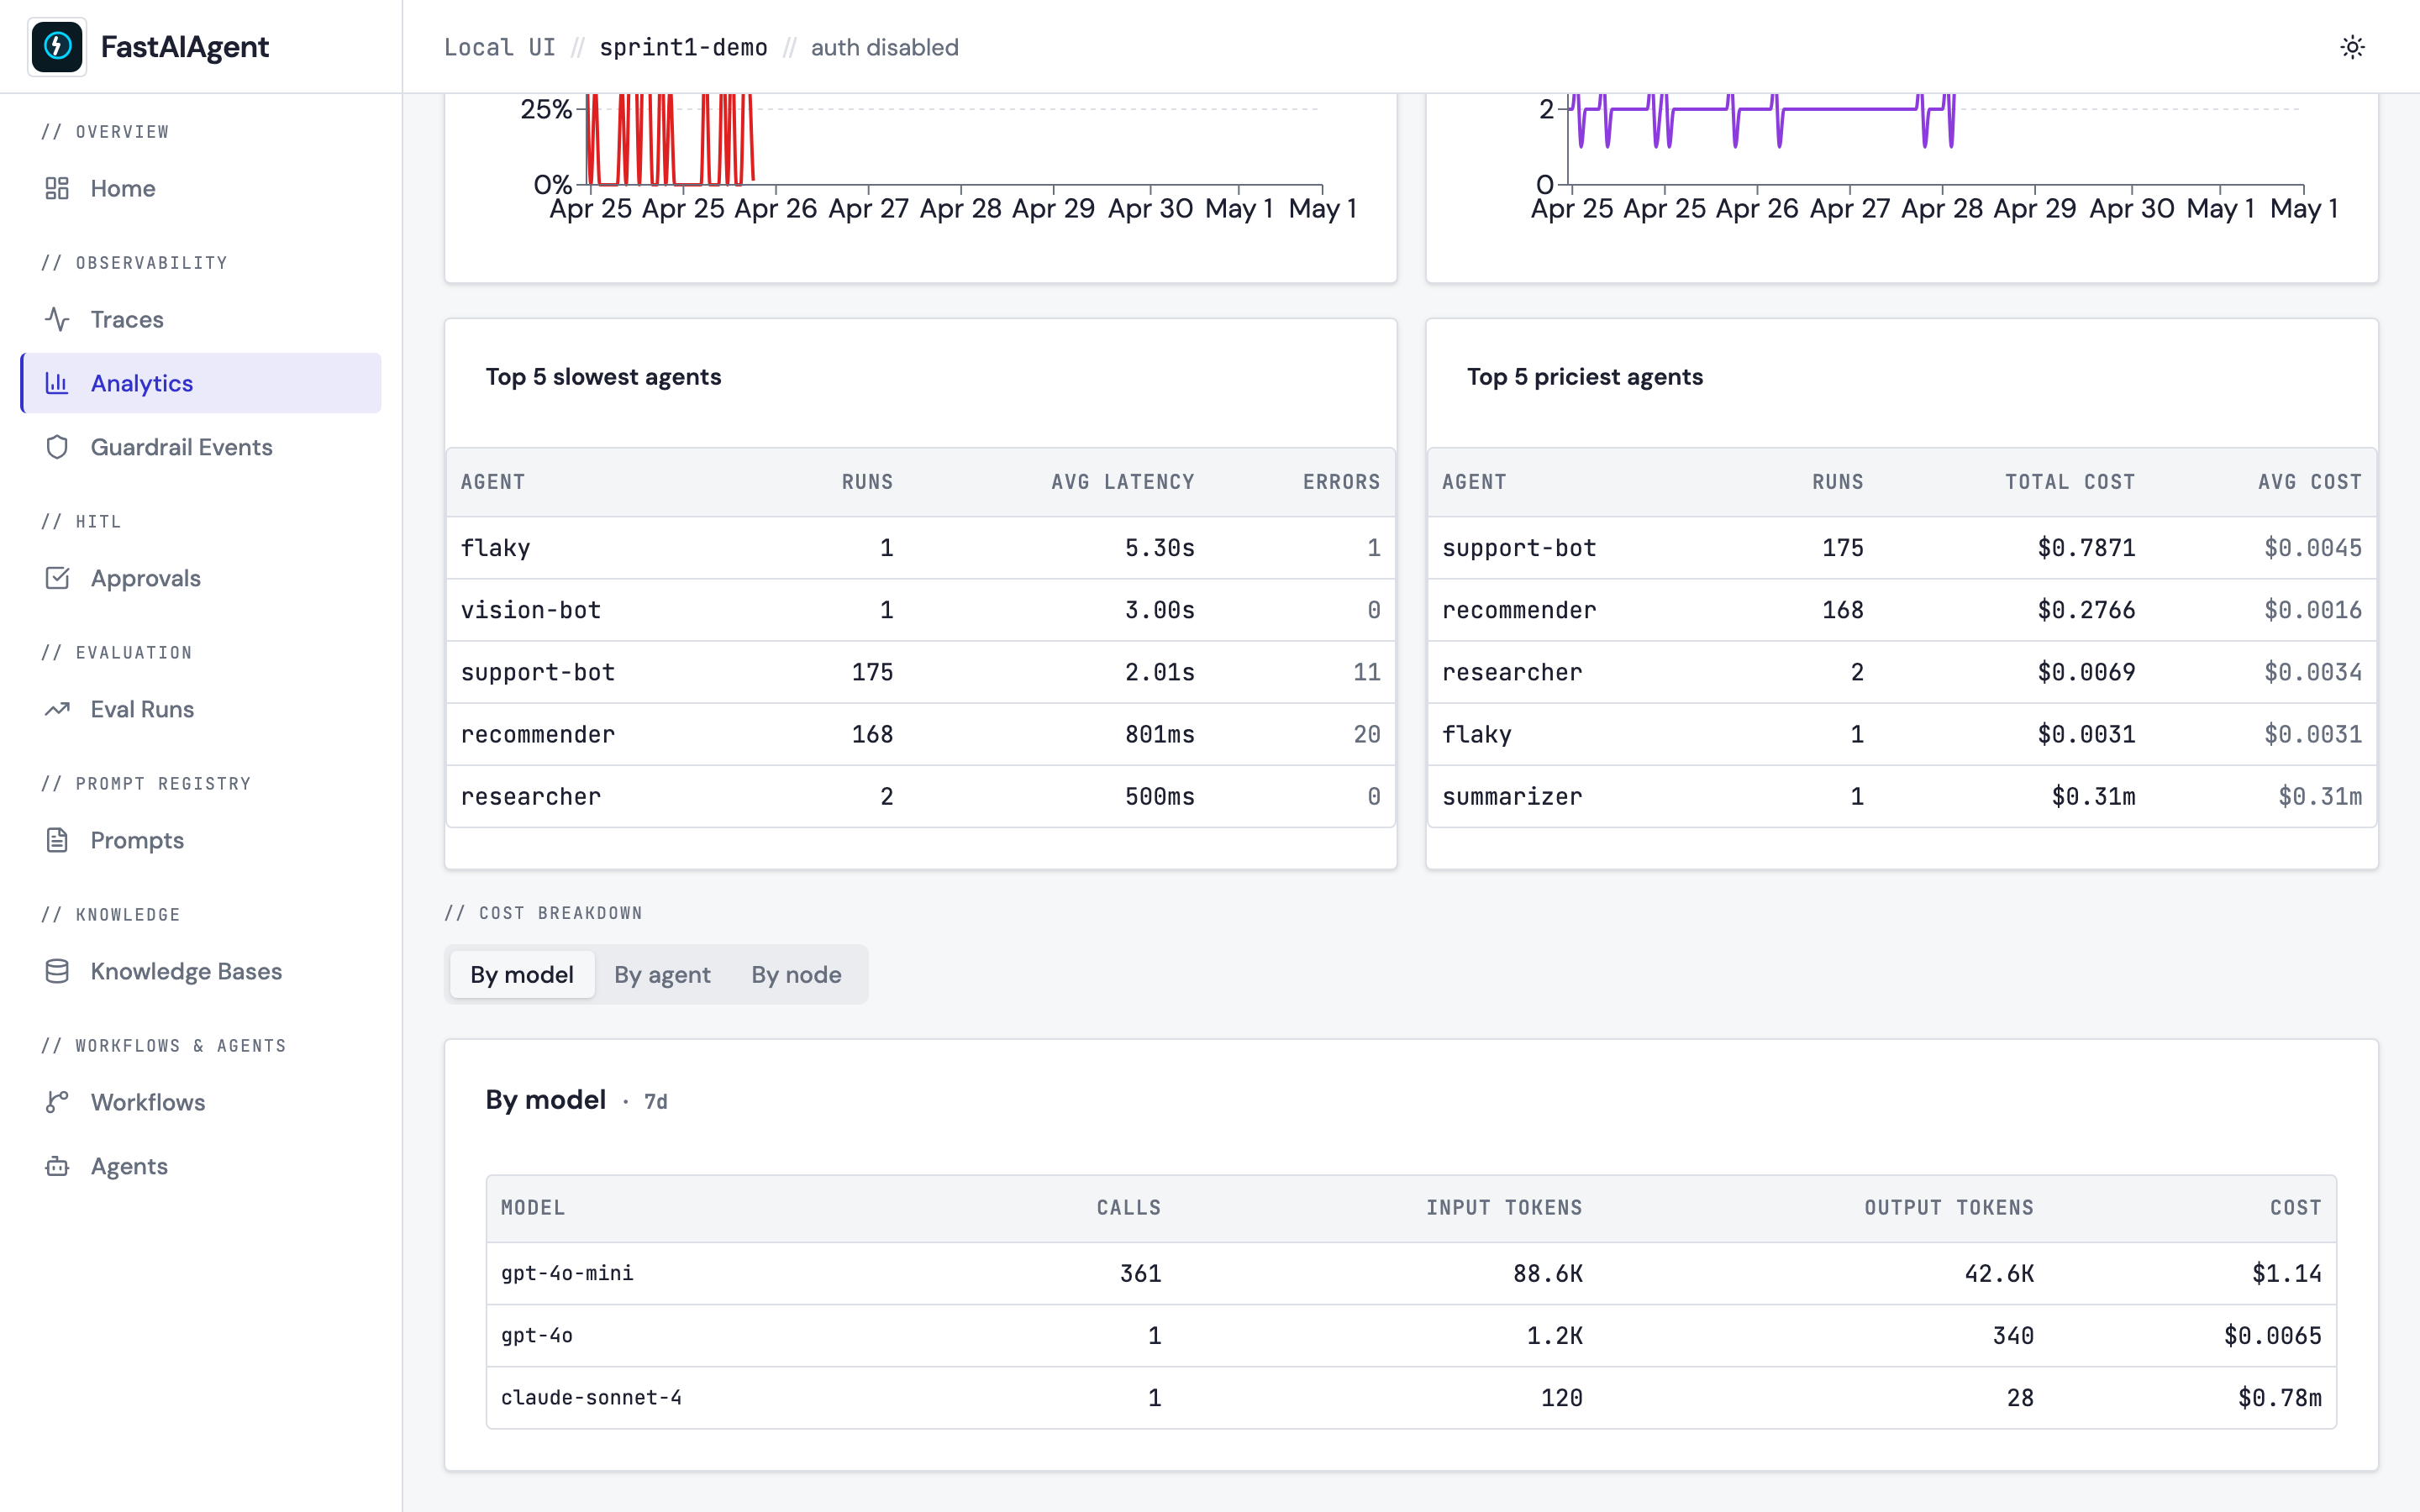
Three breakdowns
| Tab | What it groups | Useful for |
|---|---|---|
| By model | Every LLM span, bucketed by gen_ai.request.model |
"Which model is most of my spend on?" |
| By agent | Root agent spans (run count) plus their LLM children (tokens + cost) | "Which agent is most expensive per run?" |
| By node | LLM spans bucketed by chain.node_id for one named chain |
"Which node in support-flow dominates the bill?" |
The By node tab requires a chain name — type it into the input above the table:
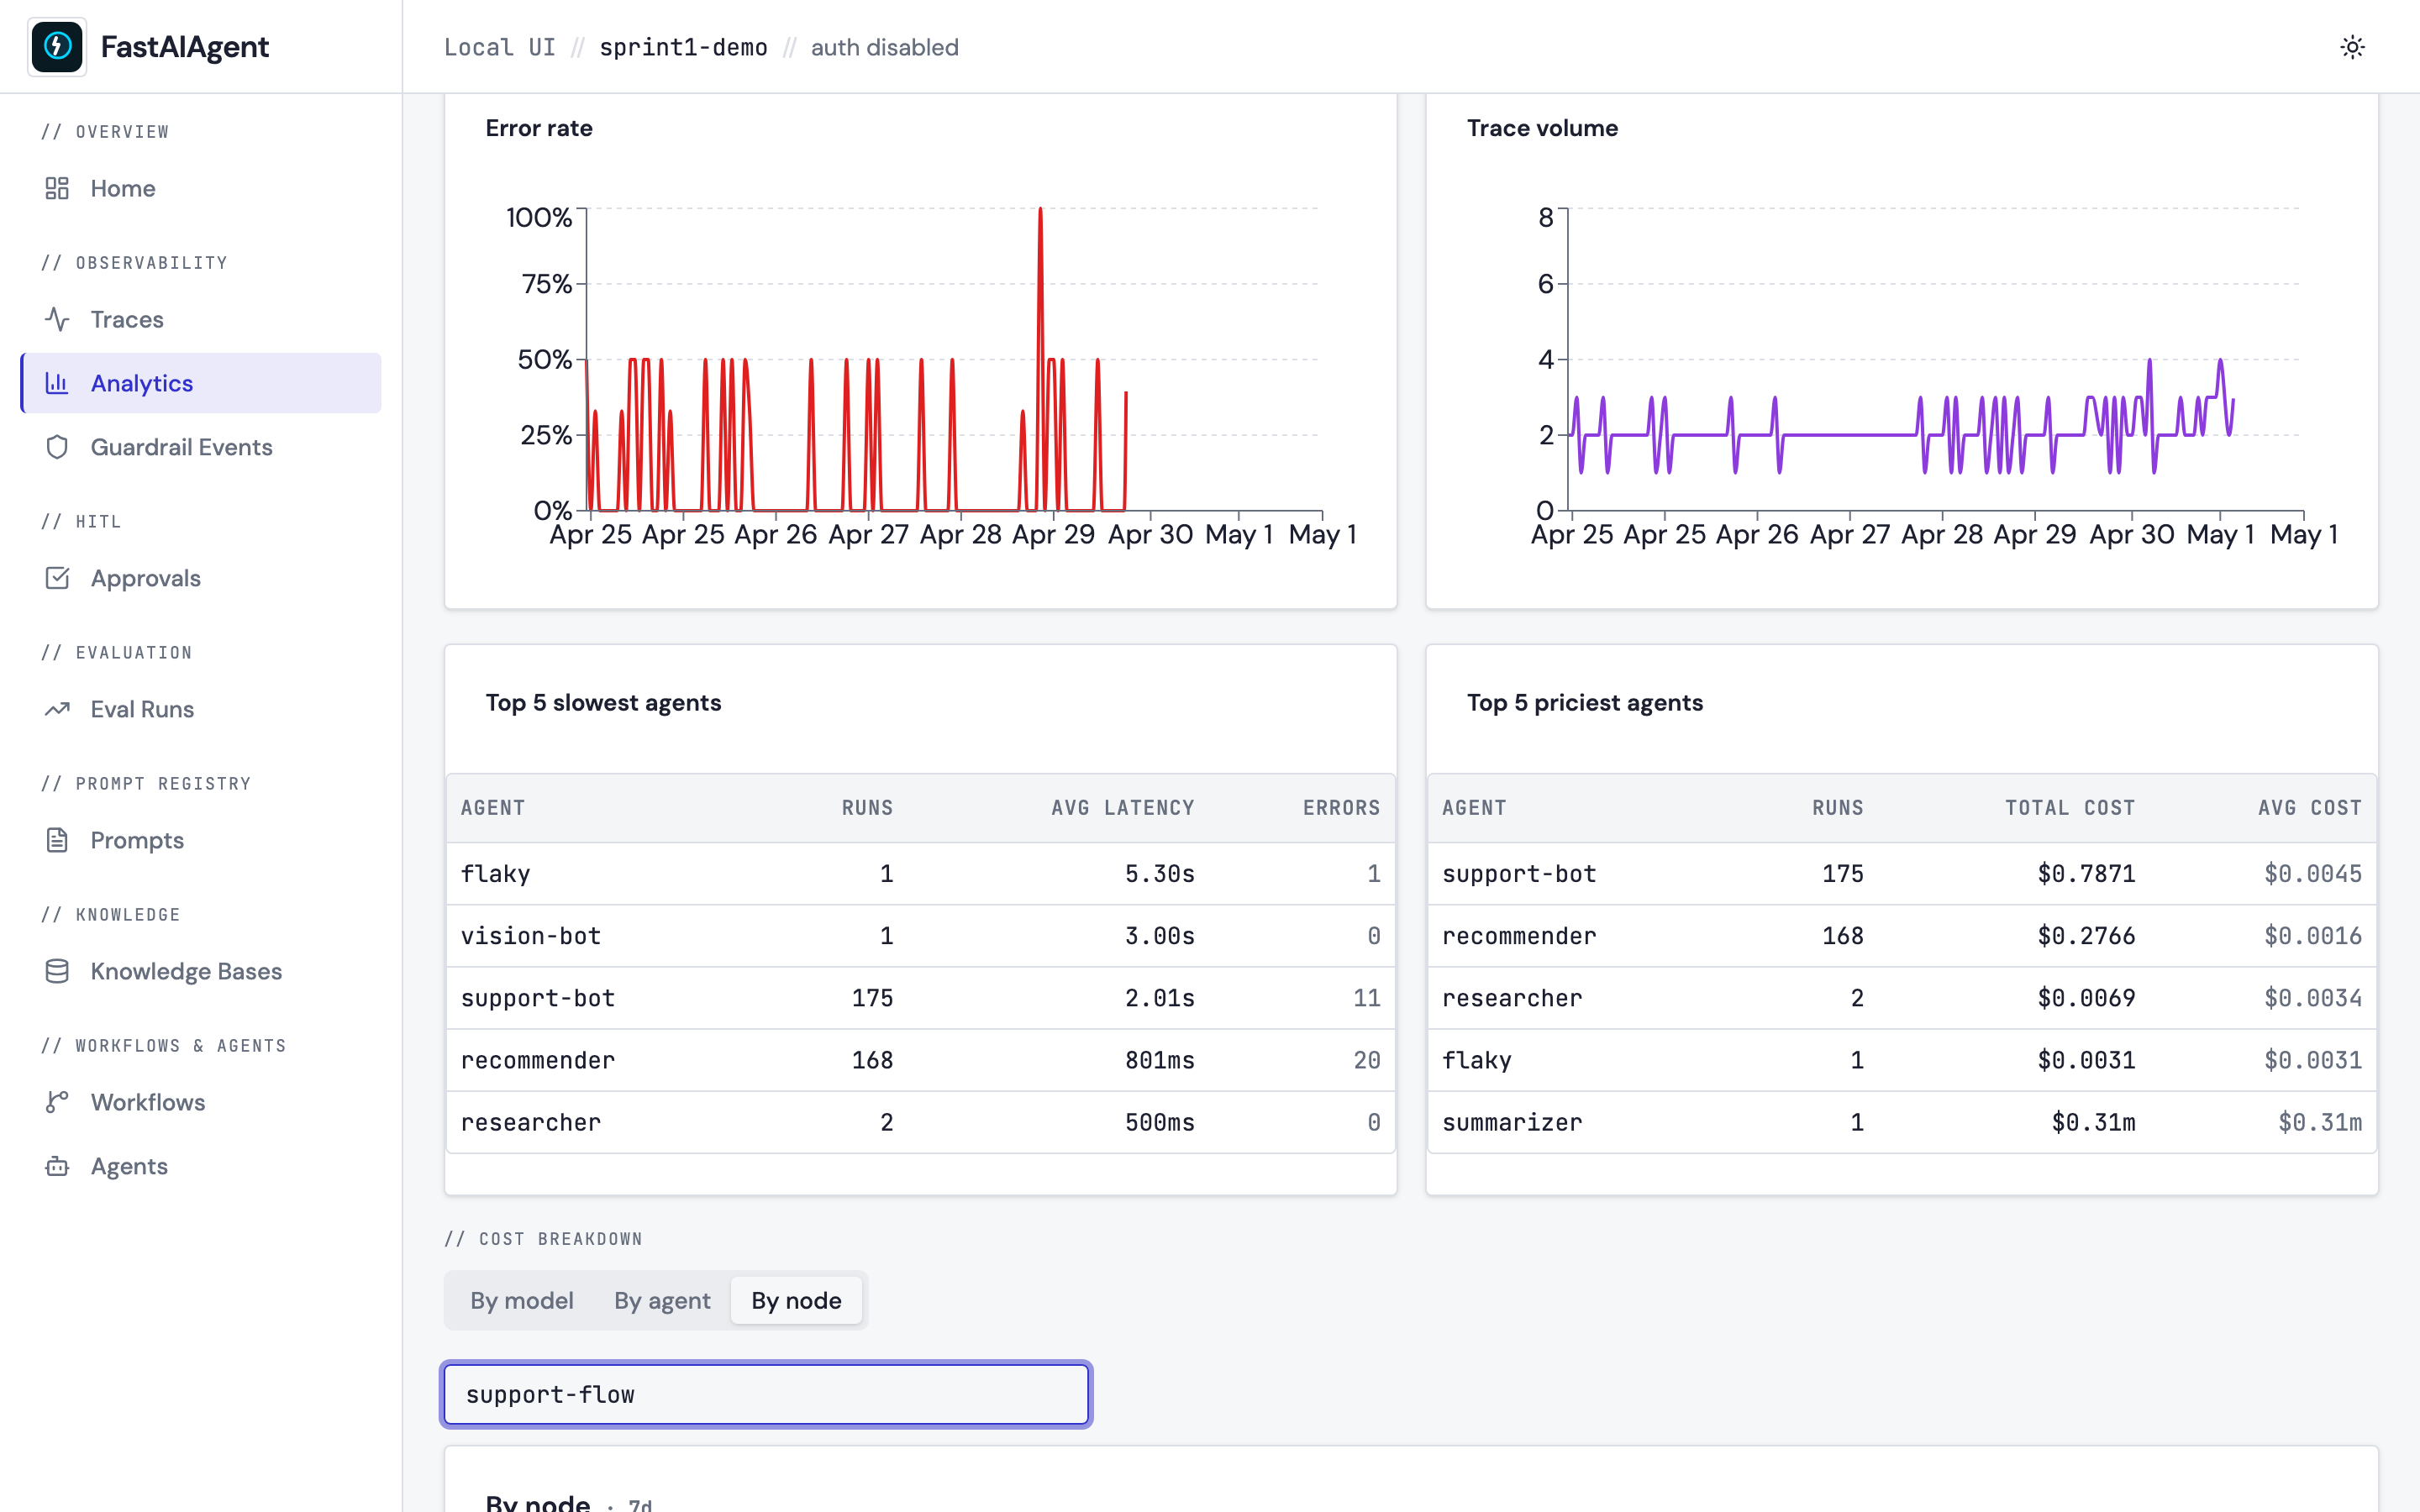
Window picker
The same 24h / 7d / 30d window picker at the top of the Analytics page
controls the cost-breakdown lookback. The mapping is:
| Page choice | Endpoint param |
|---|---|
| 24h | period=1d |
| 7d | period=7d |
| 30d | period=30d |
(period=all is also accepted by the endpoint — currently bounded to
90 days for safety.)
Endpoint
GET /api/analytics/costs?group_by=model&period=7d
GET /api/analytics/costs?group_by=agent&period=7d
GET /api/analytics/costs?group_by=node&chain_name=support-flow&period=7d
Response shape (model mode):
{
  "group_by": "model",
  "period": "7d",
  "rows": [
    {"model": "gpt-4o", "calls": 1240, "input_tokens": 2100000,
     "output_tokens": 340000, "cost_usd": 18.42}
  ]
}
For agent mode each row carries runs, avg_tokens, avg_cost_usd,
total_cost_usd. For node mode each row carries executions,
avg_duration_ms, avg_cost_usd, percent_of_total.
How cost is computed
For every LLM span the endpoint:
- Reads the cost the SDK reported on the span —
fastaiagent.cost.total_usd, or the legacyagent.cost_usd. Since 1.67.0LLMClientwritesfastaiagent.cost.total_usdon everyllm.*span it emits, which is the same attribute the LangChain, CrewAI and Pydantic-AI integrations have always set — so this path now hits for the SDK's own runs too, not only for foreign frameworks. - Falls back to
compute_cost_usd(model, input_tokens, output_tokens)fromfastaiagent/_internal/pricing.py(re-exported asfastaiagent.ui.pricing) when the explicit cost isn't set — an older trace, or a model with no rate at the time of the run. - Drops to
0.0only when both paths fail (unknown model + no reported cost).
Step 1 hitting where step 2 used to is why the figures should not move: the SDK
prices a call with the same table and the same token counts the endpoint would
have used. A model with no rate still reports nothing rather than $0.00 —
the attribute is left absent on purpose, so the estimate can take over instead
of a fabricated zero being read as fact.
This matches the rule the workflows aggregator uses, so per-workflow cost cards and the breakdown tables agree by construction.
Updating prices
The pricing table in fastaiagent/ui/pricing.py is a flat dict keyed by
model-name prefix. Longest prefix wins, so adding a new variant is
additive:
Bump the rates here whenever a provider changes their per-million pricing — the dashboards re-aggregate from raw token counts on every read, so updates apply retroactively.
Try it from the examples
Any example that runs an LLM through fastaiagent populates the cost
breakdowns. For a quick spread across multiple models / agents / chain
nodes:
examples/35_local_ui.py— produces traces, evals, and guardrail events the cost dashboard aggregates.examples/39_workflows_demo.py— runs Chain + Swarm + Supervisor in one script, so the By node tab has multiplechain_namevalues to slice.
After running either, open Analytics in the Local UI and scroll to the // COST BREAKDOWN section.
Where the screenshots come from
Both screenshots are captured by scripts/capture-sprint1-screenshots.sh
against the seed in scripts/seed_ui_sprint1.py, which lays down five
LLM spans across three models (gpt-4o, gpt-4o-mini, claude-sonnet-4)
under three agent names and three chain nodes inside support-flow.